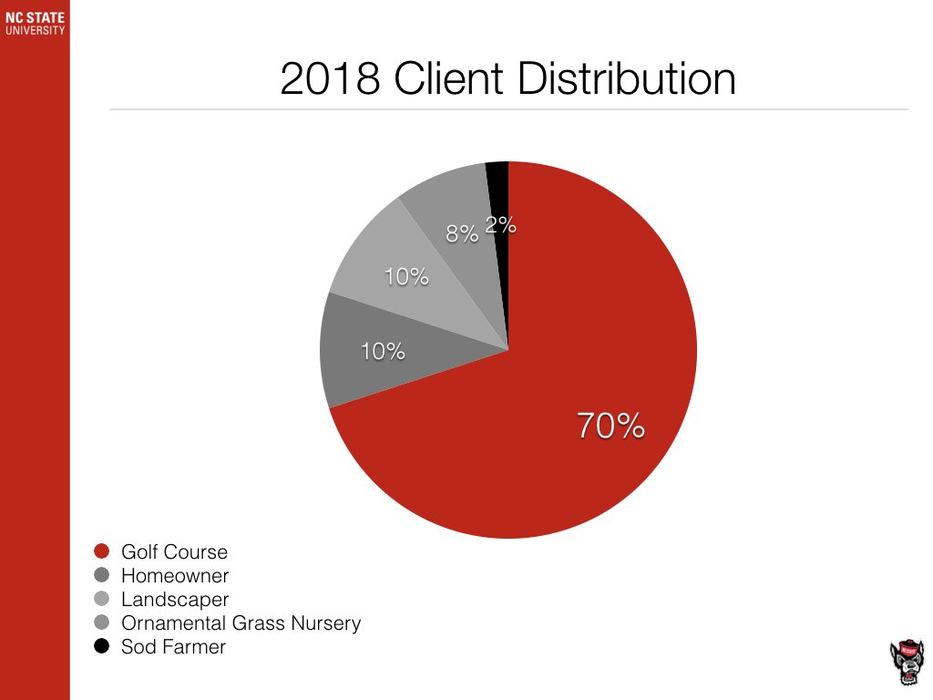
Overall, total turfgrass samples submitted in 2018 to the NC State Turf Diagnostics Lab were nearly identical to total samples submitted in 2017. As expected, the majority (70%) of our samples came from golf course putting greens. Creeping bentgrass putting green samples were up 44% while bermudagrass putting green samples were down 19% when compared to 2017. Below you will find information regarding all golf course putting green samples submitted in 2018. Enjoy!
2018 Diagnostics Lab Review
(Updated: Nov. 27, 2024, 7:30 a.m.)
WARNING! - These charts only indicate the samples we have received in our lab here at NC State. The following post focuses mainly on data collected from all golf course putting green samples (creeping bentgrass and bermudagrass).
We typically only receive samples from cases that are very hard to diagnose in the field alone. Simply put, we get the funky stuff! Therefore these charts don't necessarily represent the major disease outbreaks, but illustrate what causes the most head scratching if you will.
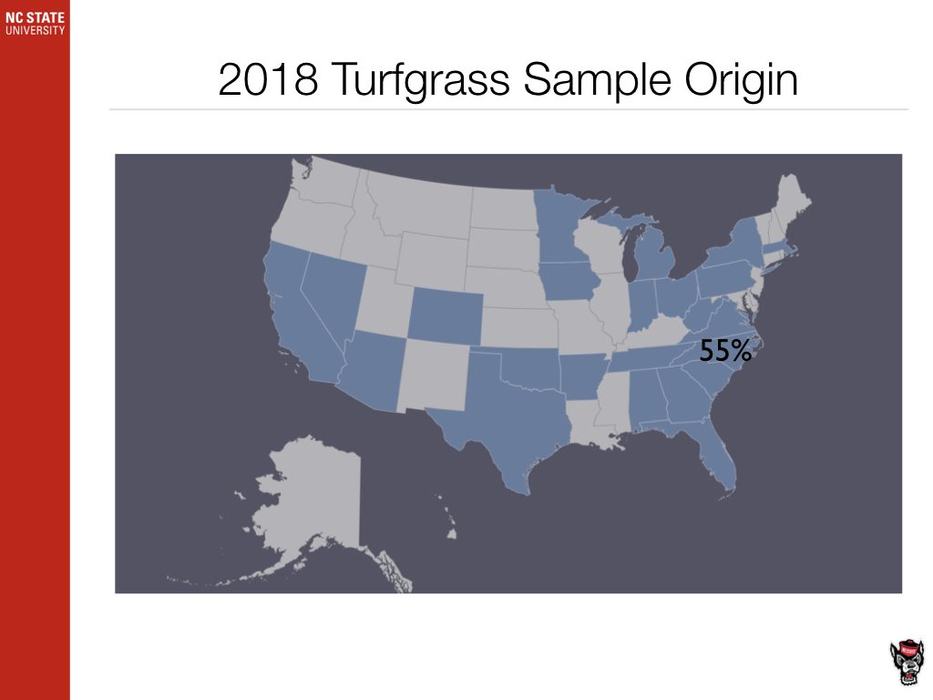
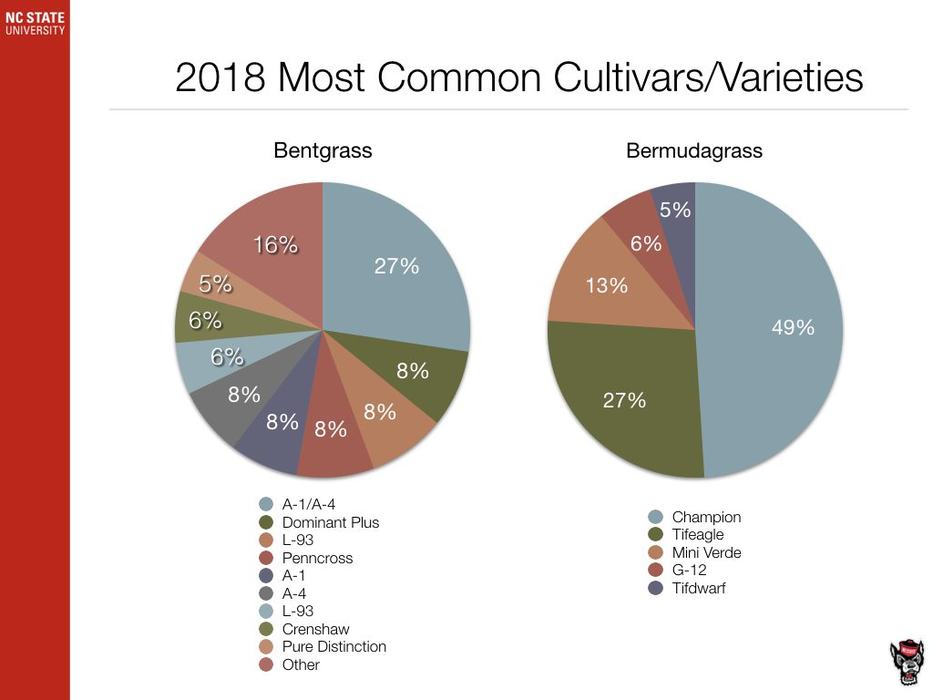
First, let's take a look at which cultivars and varieties we receive the most. This is NOT an indication of one being more susceptible to disease or problematic than another. This was compiled from all samples submitted in 2018 and would likely match any survey that asks "What do you have planted?". Remember, we receive most of our samples from the southeastern US with a lot of those coming from right here in North Carolina.
Next, let's take a look at actual disease diagnoses. If you remember from an earlier post, the majority of the time we do not find any active disease causing organisms in samples. This could be due to any number of factors such as it never was a disease, it was a disease and the damage was done too long ago to detect, or it was a disease and you've suppressed it with your fungicide program. I'm looking right at you folks who send samples after spraying everything in the barn BEFORE you collect your samples!
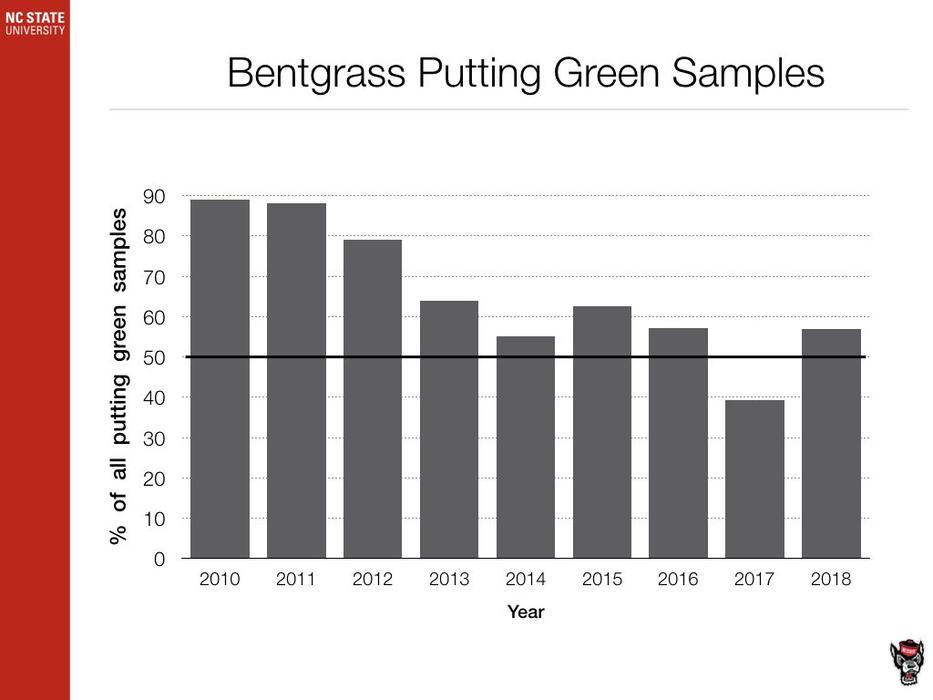
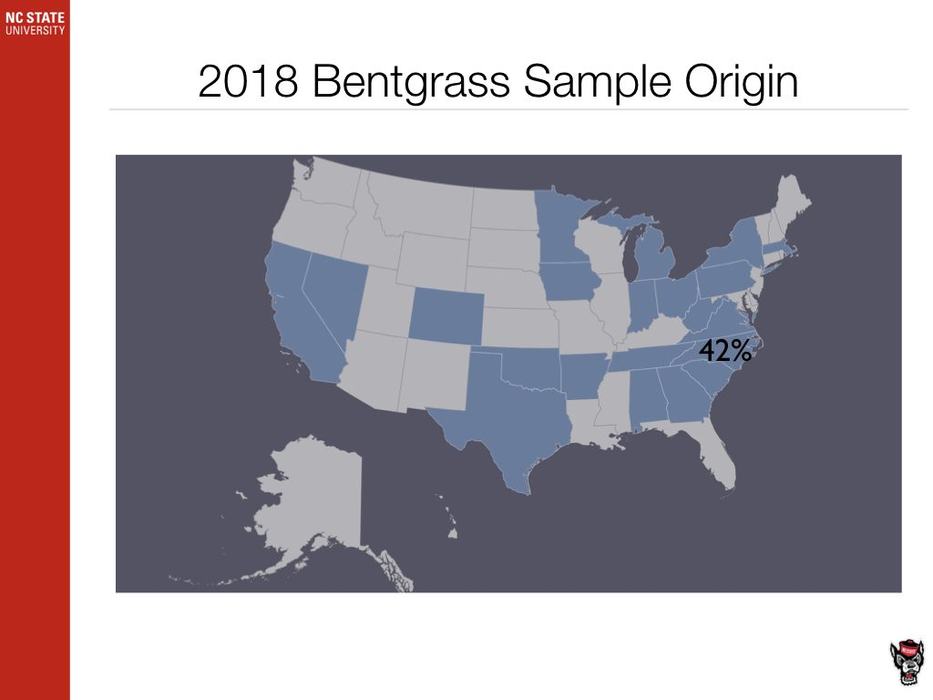
As the industry in our area continues to shift towards ultra-dwarf bermudagrass putting greens, creeping bentgrass samples appear to have settled out for now after steadily declining over the past several years. For the first time ever, we received more bermudagrass samples than creeping bentgrass samples in 2017. In 2018, however, creeping bentgrass returned to being the most submitted turfgrass species from putting greens.
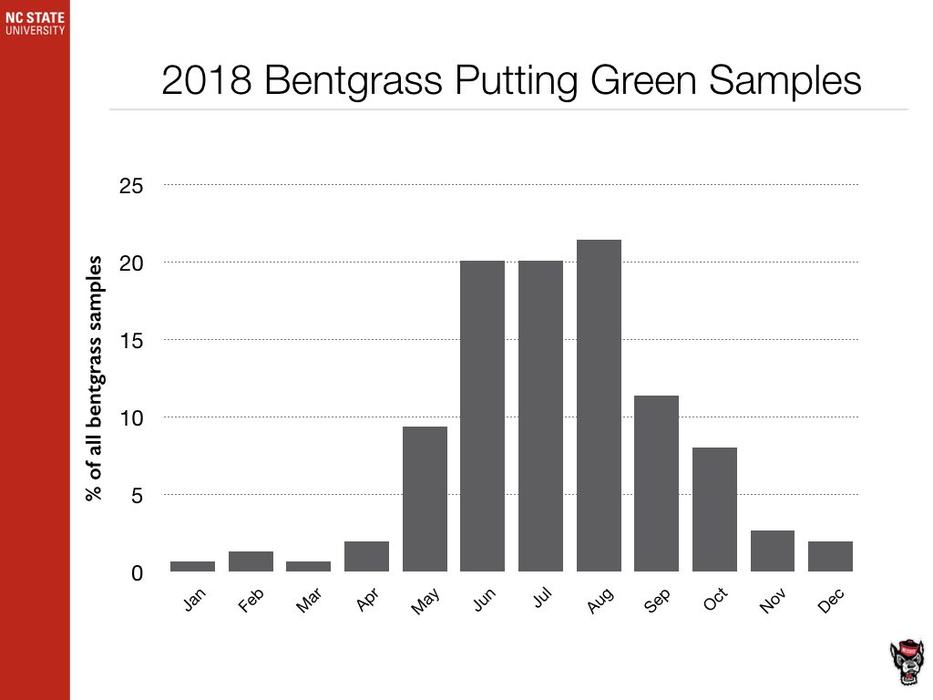
Creeping bentgrass samples did not follow trends we've observed in the past with most most samples coming June through August. In 2018, samples were spread out into the fall, most likely due to record rainfall in our region. Remember, fungi love water and turfgrass plants are more susceptible to these pathogens during prolonged wet periods.
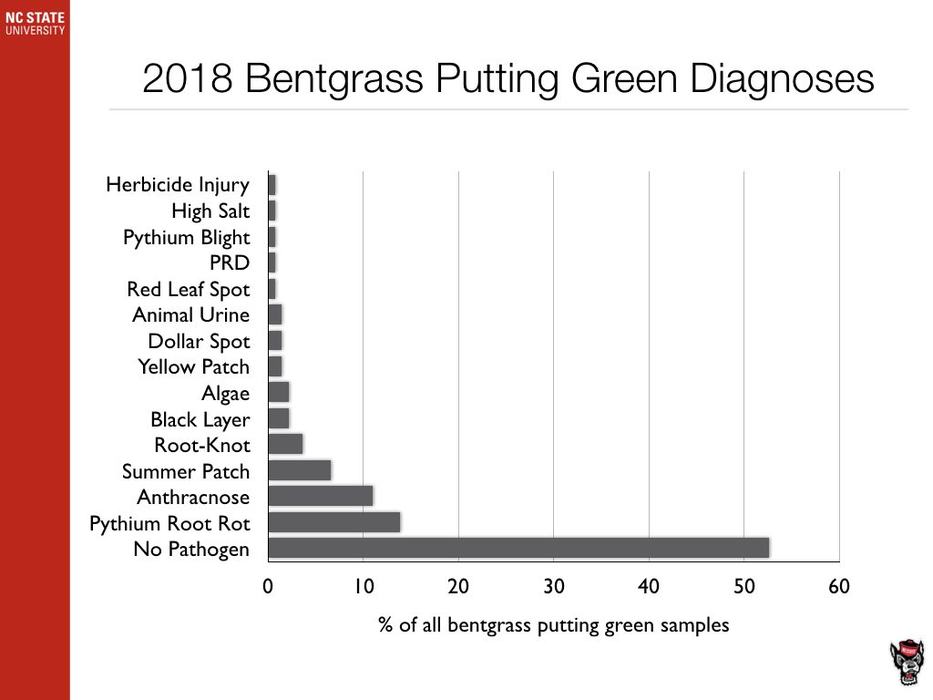
Now, think about all of the problems listed in the bar graph above. With the exception of summer patch and fairy ring when they create nice little rings, they can all look similar! It's very hard to diagnose most of these biotic and abiotic diseases in the field with 100% accuracy without looking under a microscope or testing for high salt levels. Once again, remember that rarely do growers send us samples of things like fairy ring, brown patch, dollar spot, etc. that are relatively easy to diagnose in the field. Also, receiving a diagnosis of "no disease" is equally as valuable as receiving a disease diagnosis. There are lots of things that cause turfgrass quality to decline, don't assume it has to be a disease. It should be noted that while we do not offer a service for a nematode assay, we do report root-knot nematodes because they are so easy to see in samples.
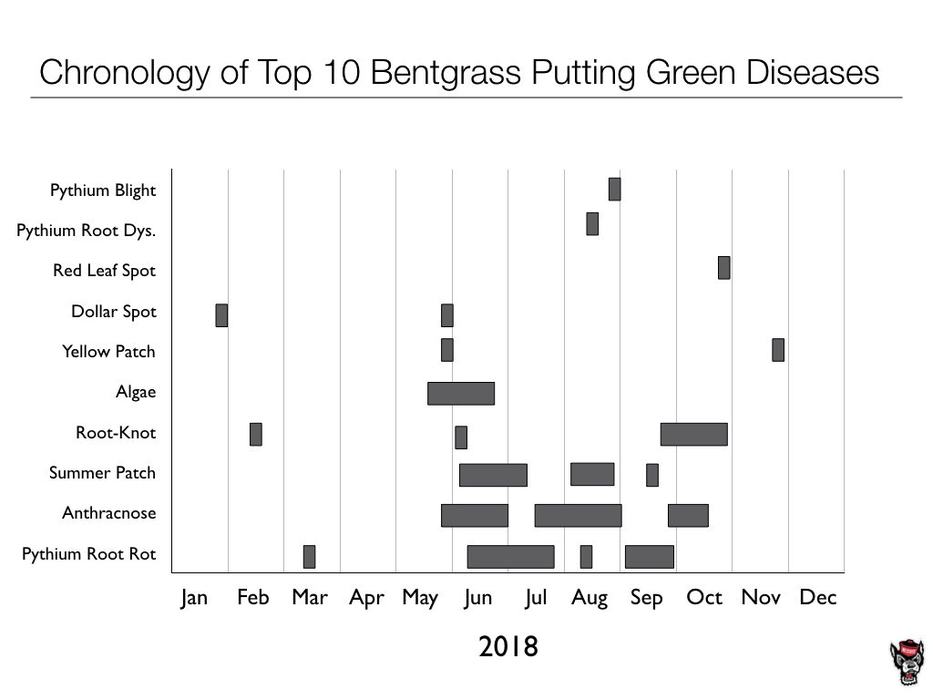
The chart above shows when each disease was diagnosed for creeping bentgrass putting green samples. The smallest bars usually indicate only a handful of confirmed cases, whereas the larger bars represent many confirmed cases through that time period. While most diseases occur when expected, you can clearly see that sometimes diseases appear unexpectedly due to short-term atypical weather patterns. A good example of this would be the several Pythium root rot diagnoses in early March.
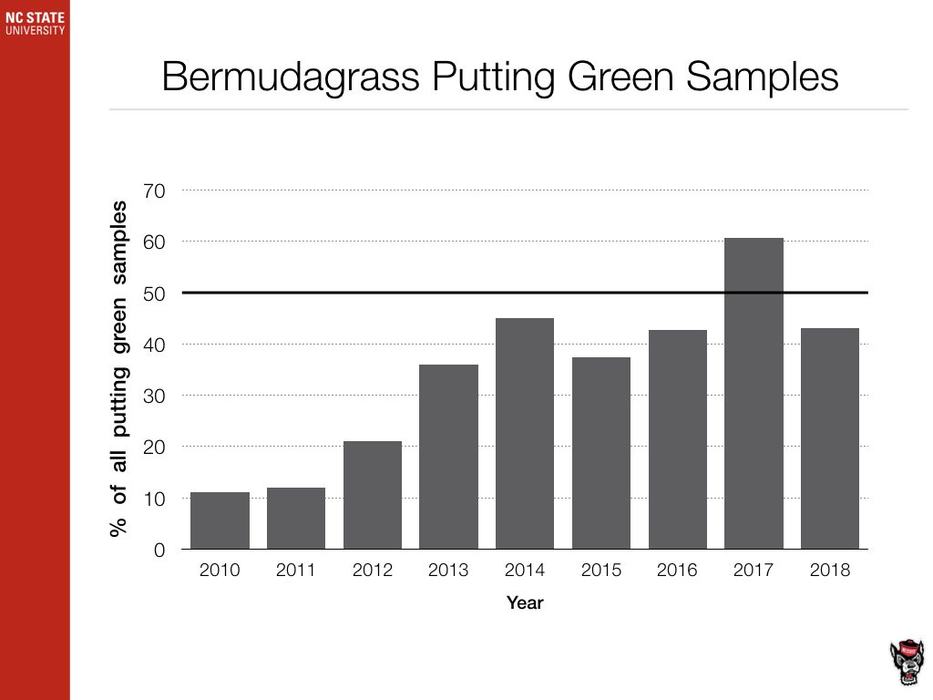
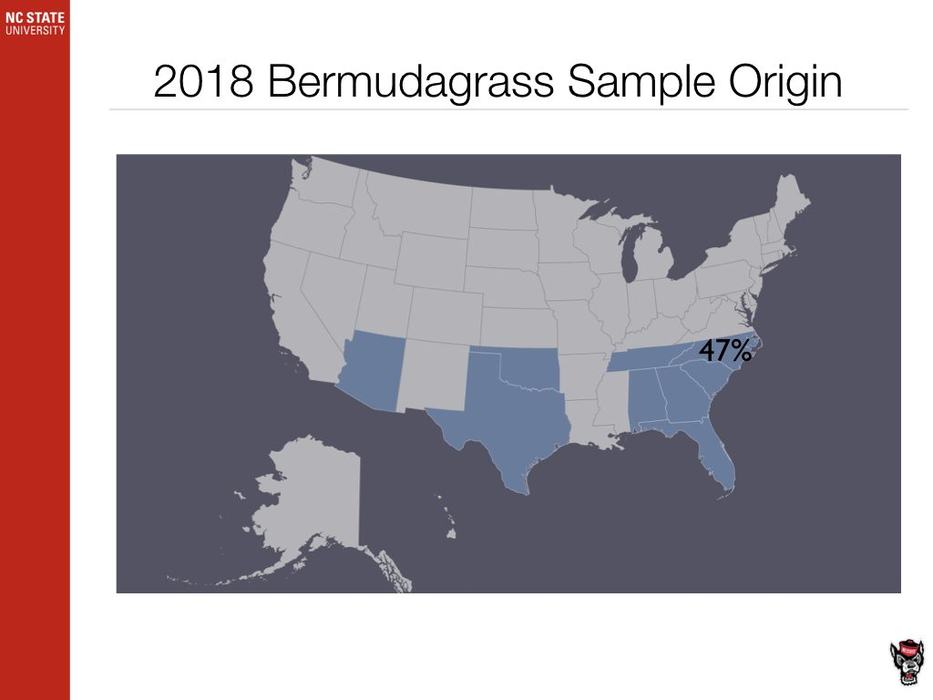
While this is the inverse of the creeping bentgrass chart above, this graph shows the rise of bermudagrass putting green samples over the past several years due to the industry shift towards these grasses for putting green surfaces as mentioned previously.
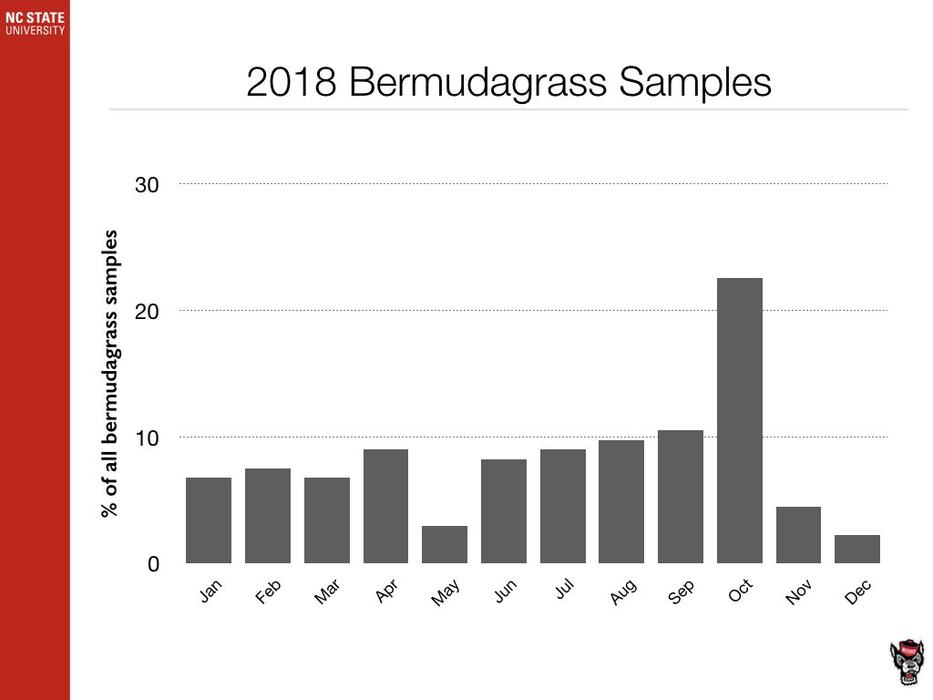
Bermudagrass sample submissions by month follow a very similar path each and every year. The problems are fairly well distributed throughout the year with a spikes in the spring and fall. In particular, there was a large spike in October of 2018, most likely due to record rainfall and tropical systems in our region during a period when warm-season turfgrass growth is not optimal.
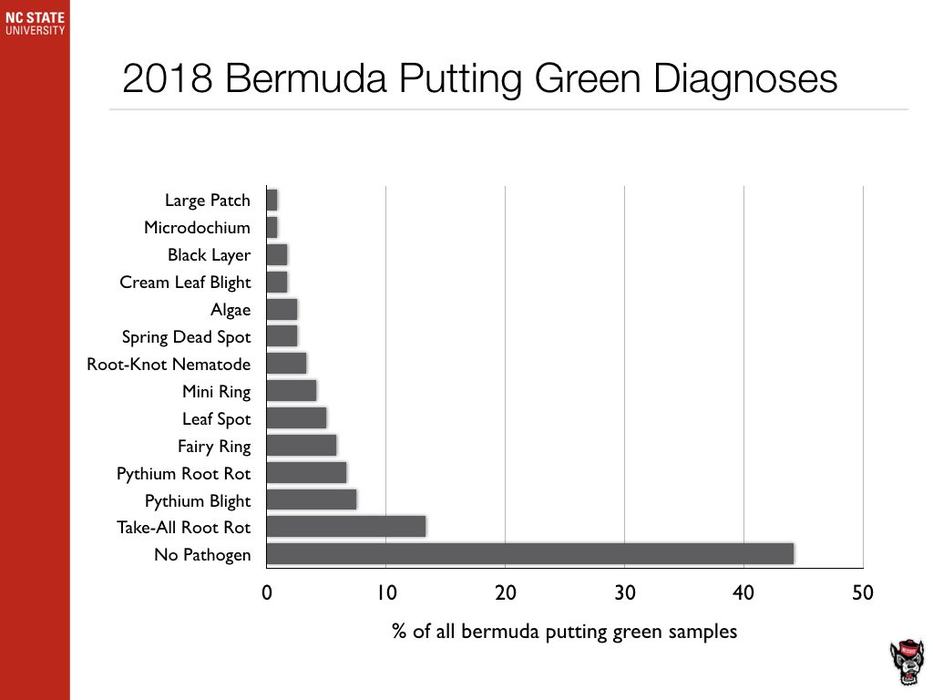
Just like in 2017, take-all root rot remains at the top of the list. We saw a significant increase in the occurrence of this disease starting in fall of 2015 when weather conditions were abnormally wet and warm for extended periods of time. Just like bentgrass diseases, a lot of these can look alike and require a microscope to make an accurate diagnosis. Our lab does not test for nematodes, however we will report root-knot nematodes when they are observed in high numbers because the attached females are very easy to see while all other nematodes go down the drain when we wash soil away from the roots for disease diagnosis. Finally, the Pythium diseases (blight and root rot) made their way up the list from 2017, again most likely due to the record rainfall in our region.
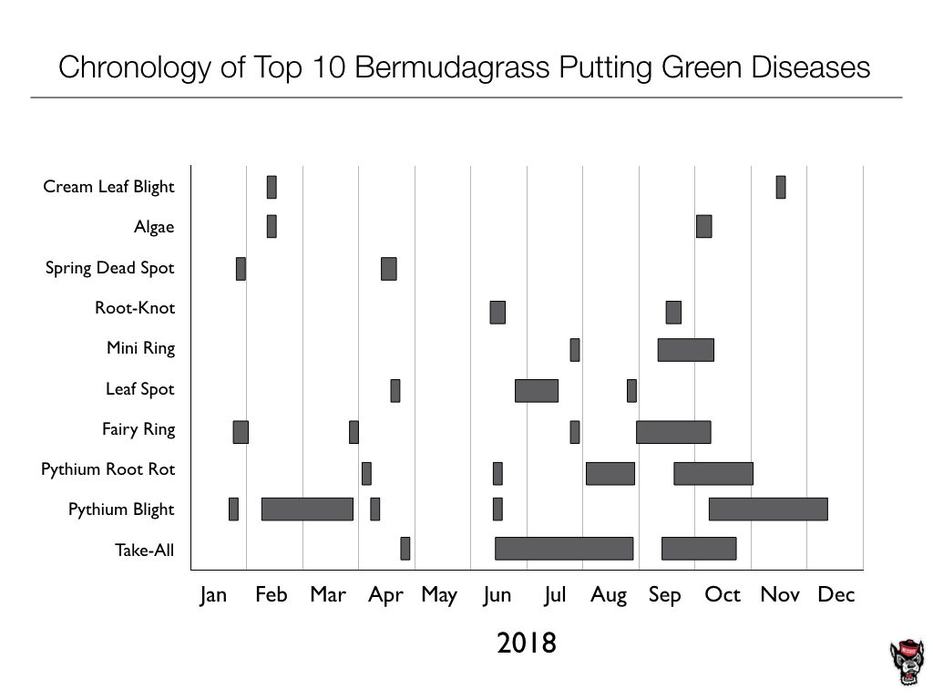
The chart above shows when each disease was diagnosed for bermudagrass putting green samples. The smallest bars usually indicate only a handful of confirmed cases, whereas the larger bars represent many confirmed cases through that time period. While most diseases occur when expected, you can clearly see that sometimes diseases appear unexpectedly due to short-term atypical weather patterns. A good example of this would be the sporadic nature of Pythium blight that was most likely tied with wet periods in the regions from where those samples came from. Finally, we received a lot of mini-ring samples late summer through early fall with a lot of those diagnoses being made over email and text messages via photos, which are not counted as physical samples as represented above. We believe mini ring is more severe under low fertility and it's likely those affected may have lost more fertility than they realized during the extended rainfall periods prior to symptom development.
Bottom line: As you can clearly see, both bentgrass and bermudagrass have their fair share of disease issues!