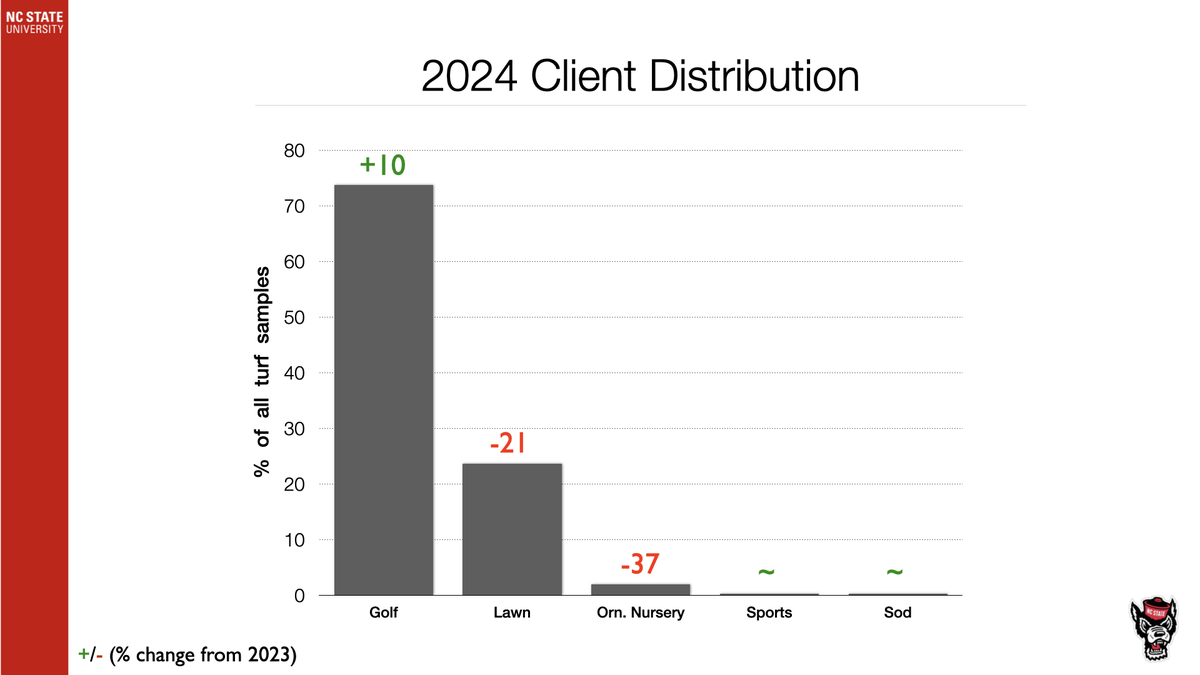
Overall, total turfgrass samples submitted in 2024 to the NC State Turf Diagnostics Lab were 6% lower than samples submitted in 2023 and 7% above our 15-year running average. As expected, most (74%) of our samples came from golf course putting greens, up 10% from 2023. We always combine creeping bentgrass and annual bluegrass data because most of these samples are pure creeping bentgrass, and they typically have the same disease issues as annual bluegrass.
Below is information regarding all golf course putting green samples submitted in 2024. Enjoy!
WARNING! – These charts only indicate the samples we have received in our lab here at NC State. The following post focuses mainly on data collected from golf course putting green samples (creeping bentgrass/annual bluegrass and bermudagrass).
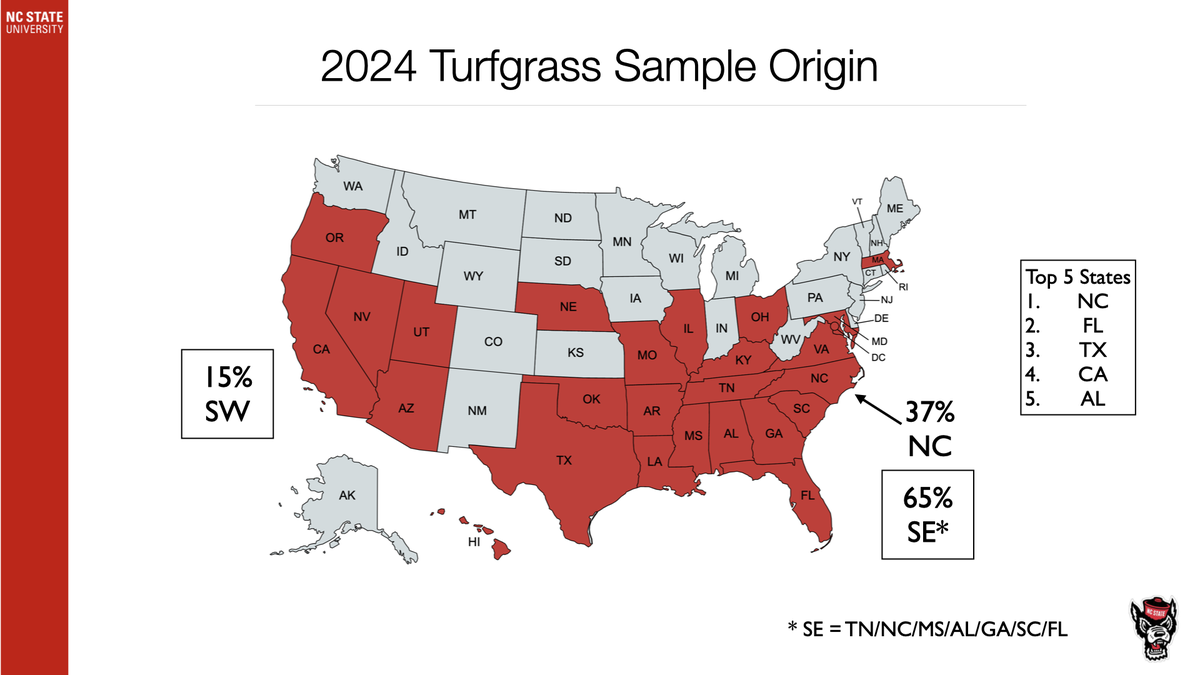
37% of all turfgrass samples came from North Carolina. 65% of all turfgrass samples came from the SE United States. The top five states were NC, FL, TX, CA, and AL.
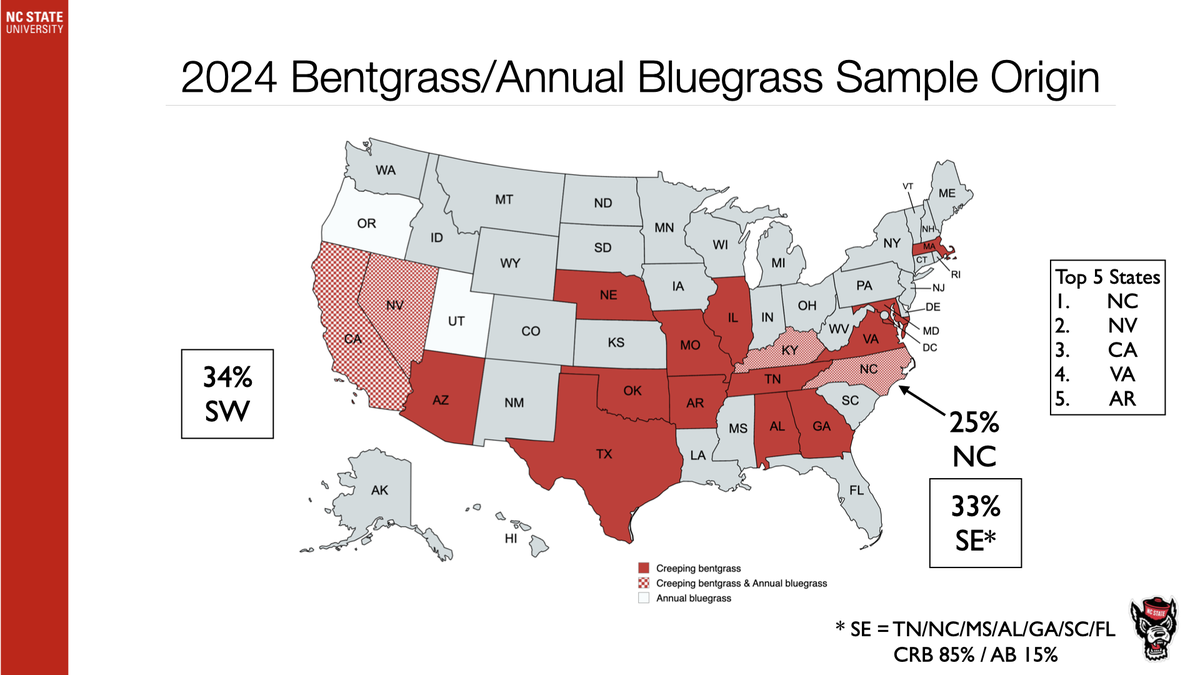
25% of all creeping bentgrass/Poa putting green samples came from NC. 33% of all creeping bentgrass/Poa putting green samples came from the SE United States. The top five states were NC, NV, CA, VA, and AR.
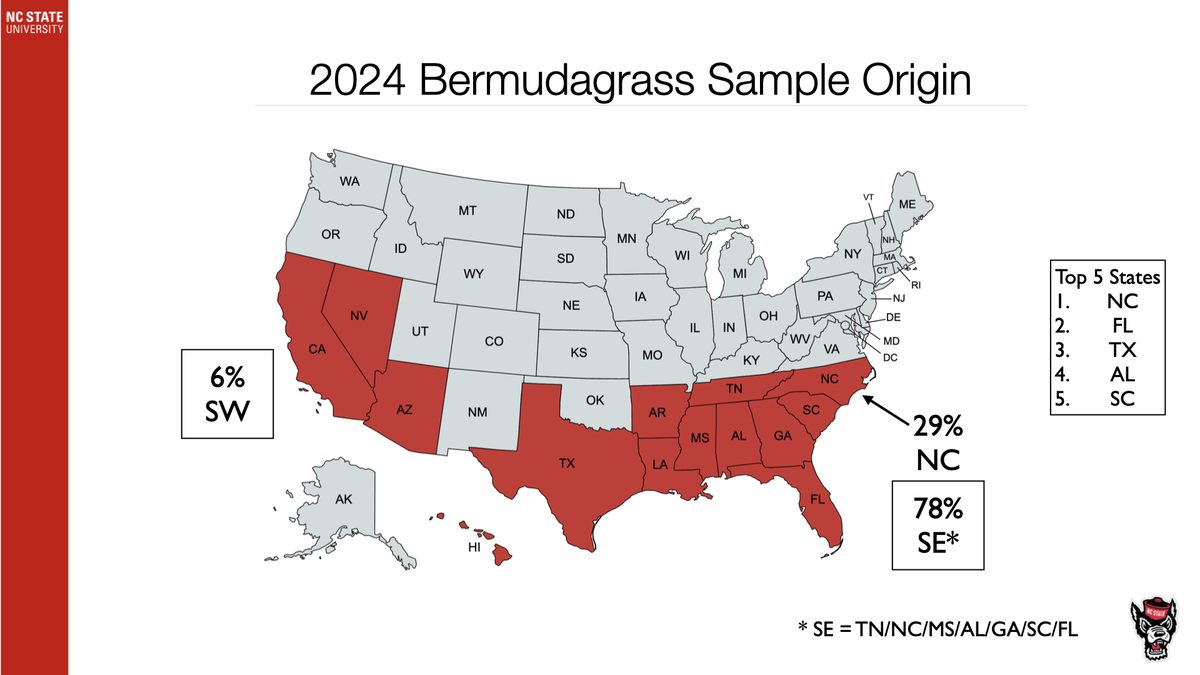
29% of all bermudagrass putting green samples came from NC. 78% of all bermudagrass putting green samples came from the SE United States. The top five states were NC, FL, TX, AL, and SC.
We typically receive samples from cases that are hard to diagnose in the field alone. Therefore, these charts don’t necessarily represent all primary disease outbreaks but illustrate issues requiring a microscope and/or expert confirmation. This is why you will see little to no diagnoses of diseases that are relatively easier to diagnose in person, such as dollar spot, brown patch, etc.
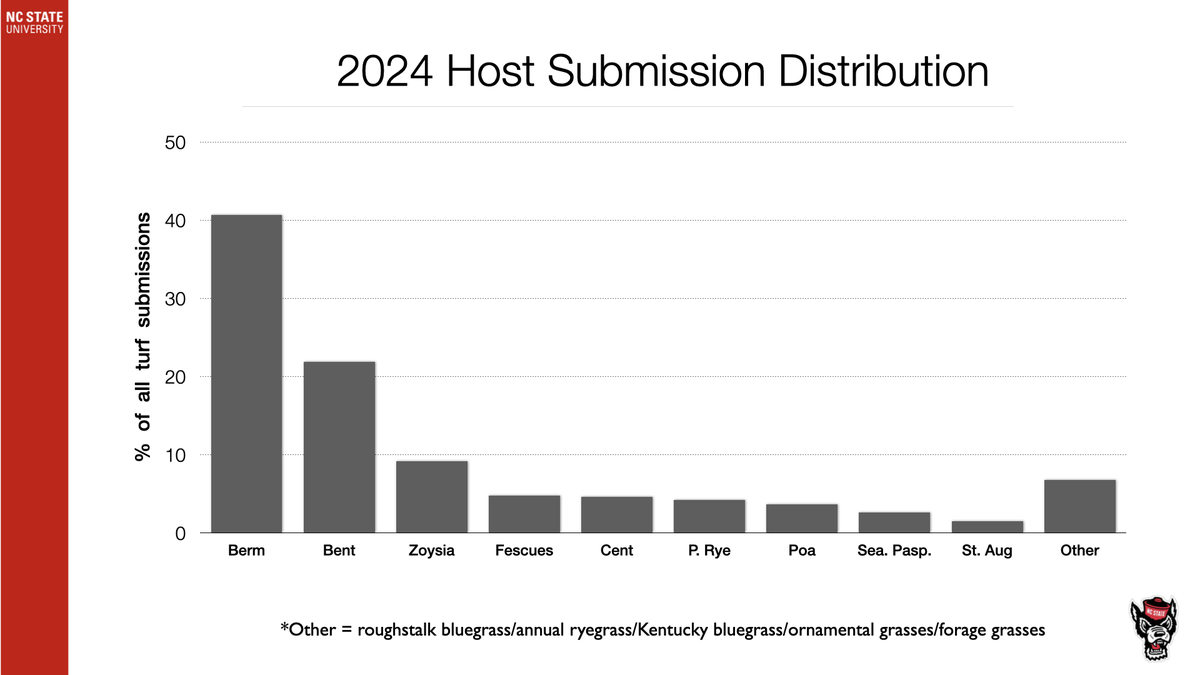
Distribution of all samples submitted to our lab in 2024.
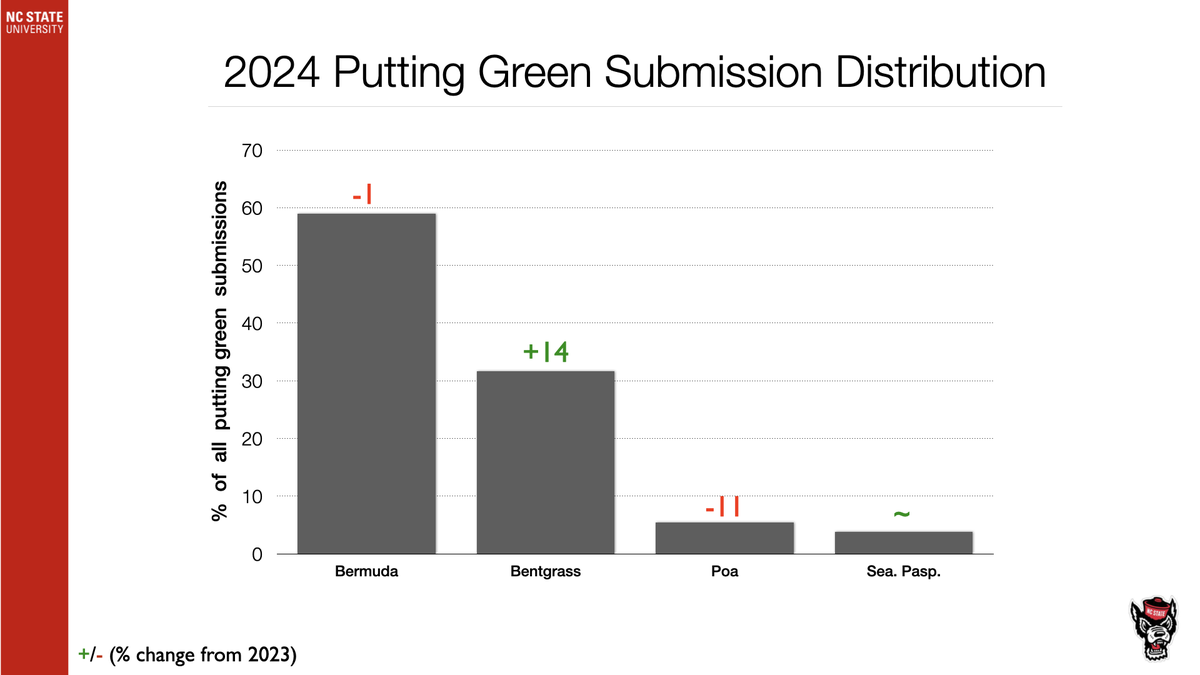
Bermudagrass putting green samples were only down 1% compared to 2023, creeping bentgrass was up 14%, and Poa annua was down 11%. Seashore paspalum samples had no change compared to 2023.
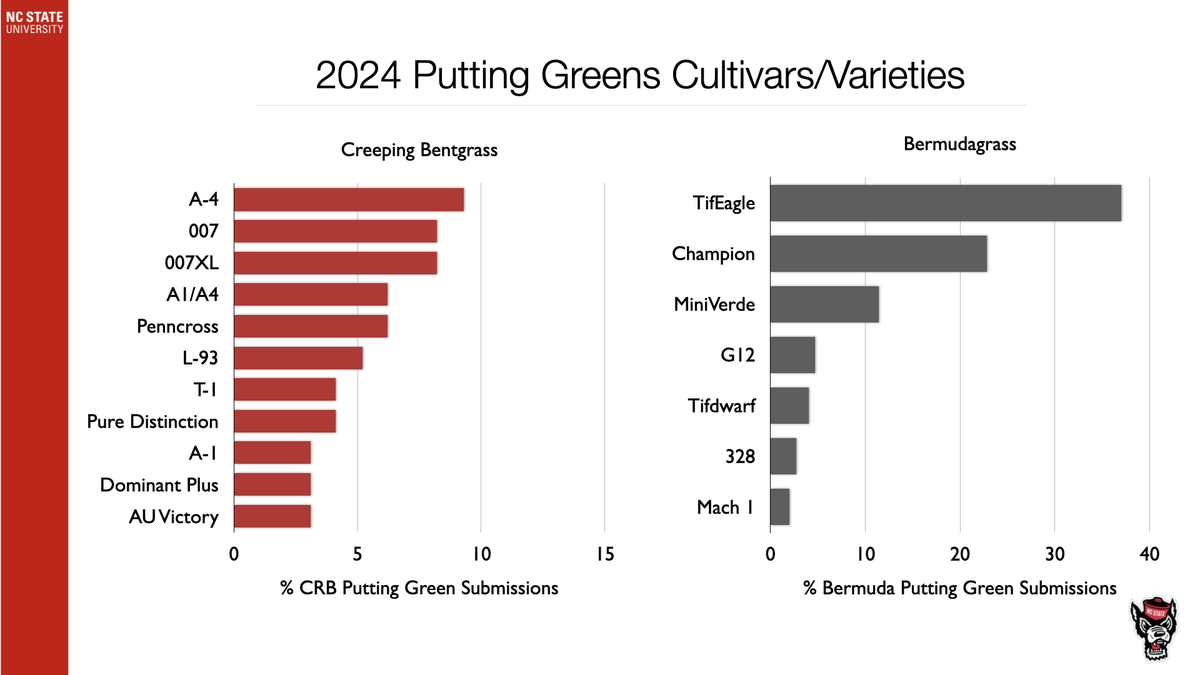
Now, let’s look at which cultivars and varieties we receive the most. This does NOT indicate one being more susceptible to disease or problematic than another. This was compiled from all samples submitted in 2024 and would likely match any survey that asks, “What do you have planted?”. Remember, 33% of creeping bentgrass/Poa samples and 78% of bermudagrass samples are from the southeastern United States.
Putting green cultivar/variety distribution for samples submitted in 2024.
Next, let’s take a look at actual disease diagnoses. If you remember from an earlier post, ~50% of the time, we do not find any active pathogens in samples. This could be due to several factors, such as it never was a disease, it was a disease, and the damage was done too long ago to detect, or it was a disease and you’ve suppressed it with your fungicide program. This is why collecting your samples for disease diagnosis is very important before they are sprayed (please and thank you!).
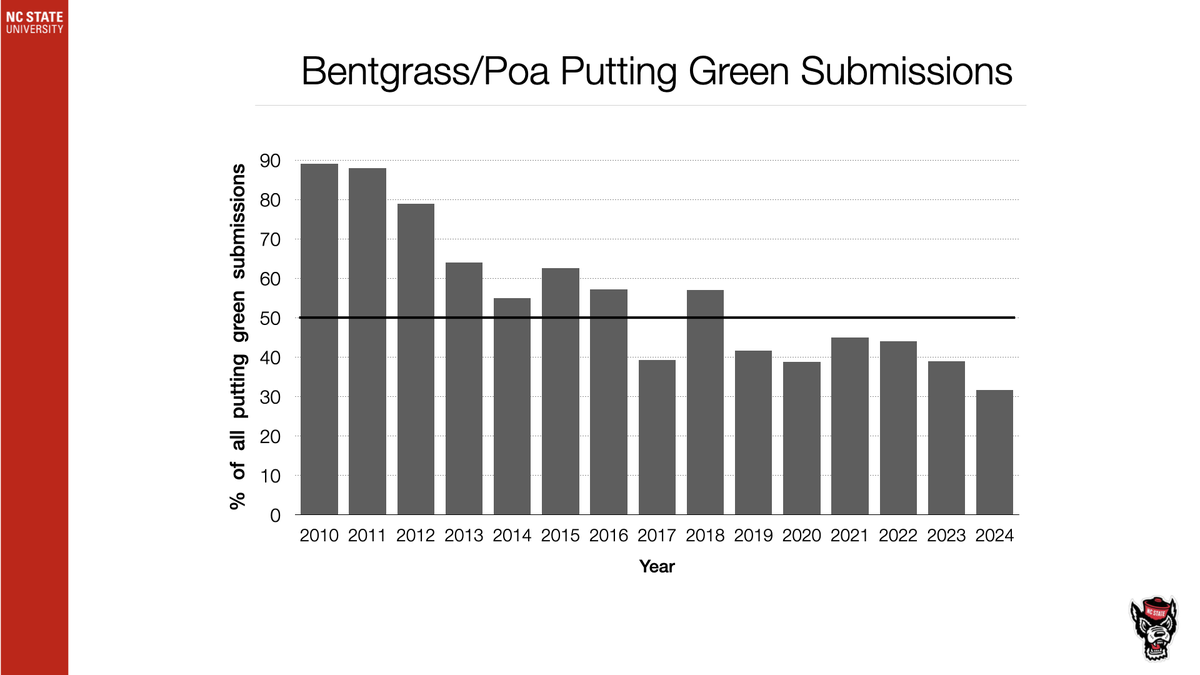
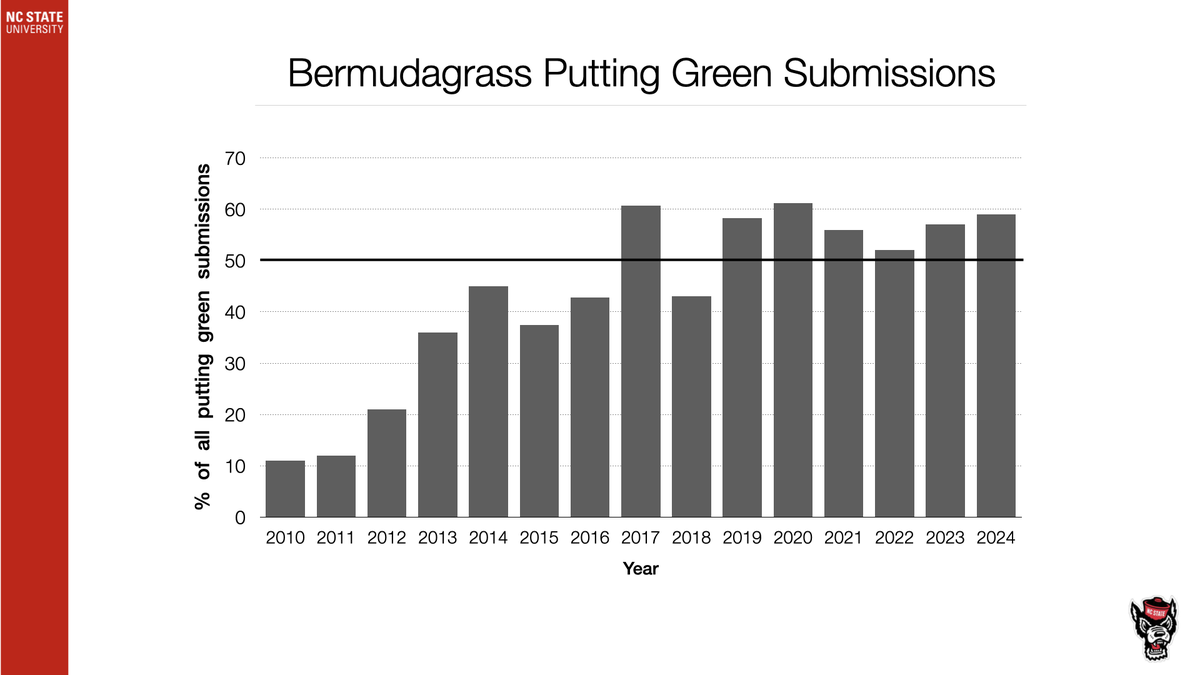
As the industry in our area shifted towards ultradwarf bermudagrass putting greens during the past decade or so, creeping bentgrass samples continue to hold steady at their current level of submission rate of 30-40% over the past several years.
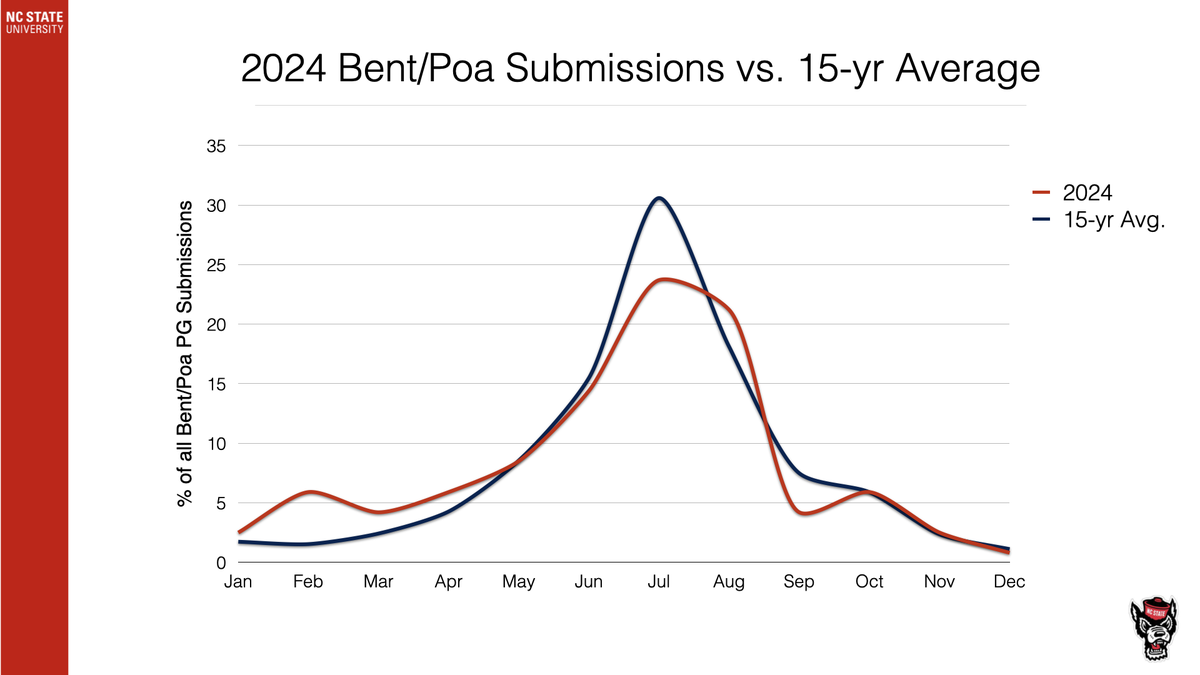
Bent/Poa samples followed a relatively normal monthly distribution pattern, with most samples coming during the summer. This is best illustrated in the graph above compared to the 15-year average.
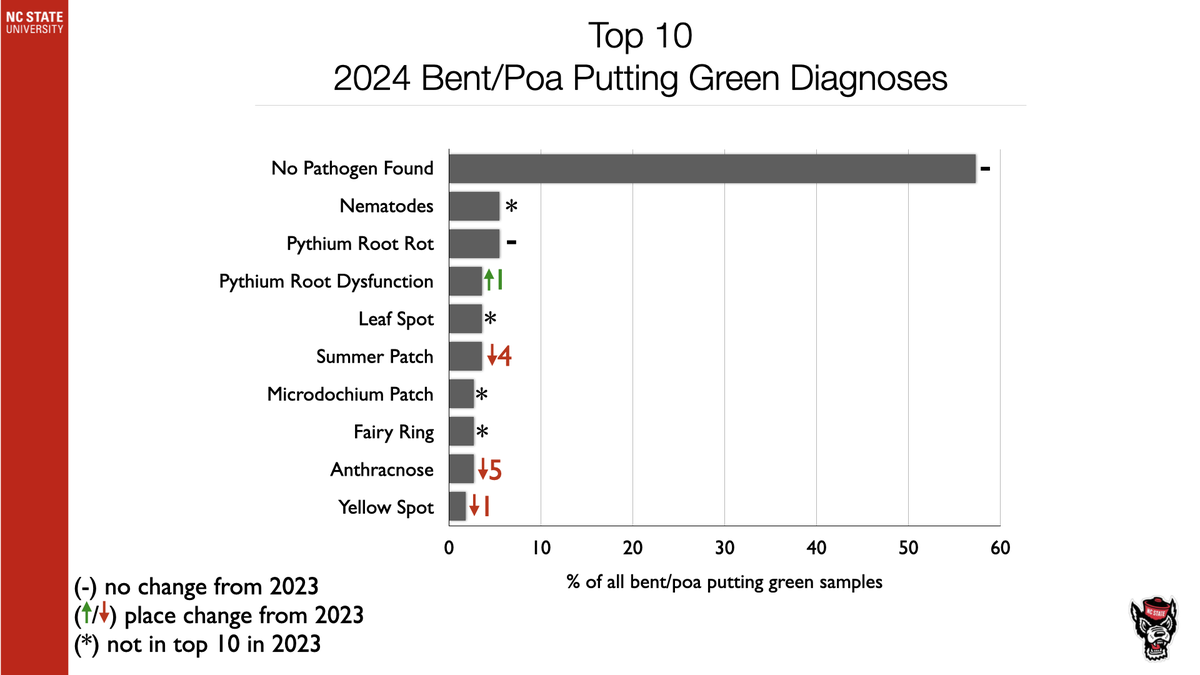
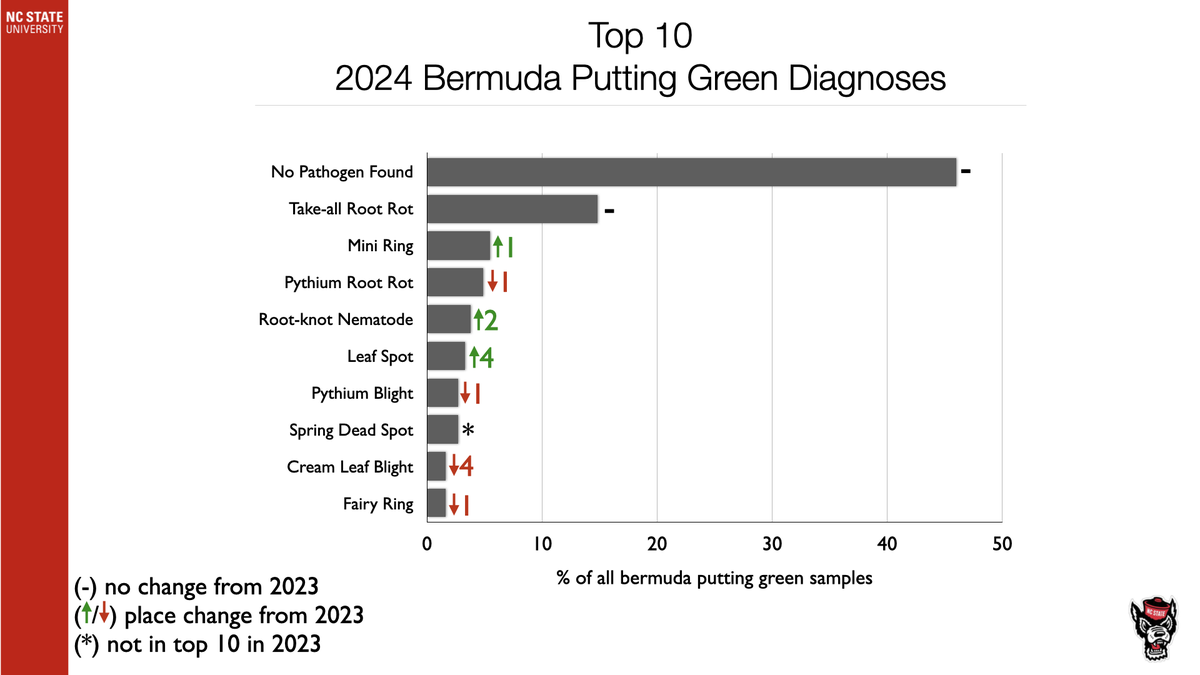
For the first time, nematodes made it to the top of the list almost tied with Pythium root rot. It should be noted that while we do not offer a nematode assay service, we report root-knot and lance nematodes. They are easy to see because they are endoparasites (inside the roots) and don’t get washed away like ectoparasites (outside the roots) when we rinse soil away from roots to detect fungal pathogens. We have observed a steady rise in issues with root-knot nematodes over the past several years in both creeping bentgrass and bermudagrass putting greens.
While we saw a sharp decrease in Pythium root rot samples in 2023 compared to years past, the disease still lingers and causes issues for some turfgrass managers.
Also, receiving a diagnosis of “no pathogen found” is equally as valuable as receiving a disease diagnosis. Many things cause turfgrass quality to decline, so don’t assume it has to be a disease.
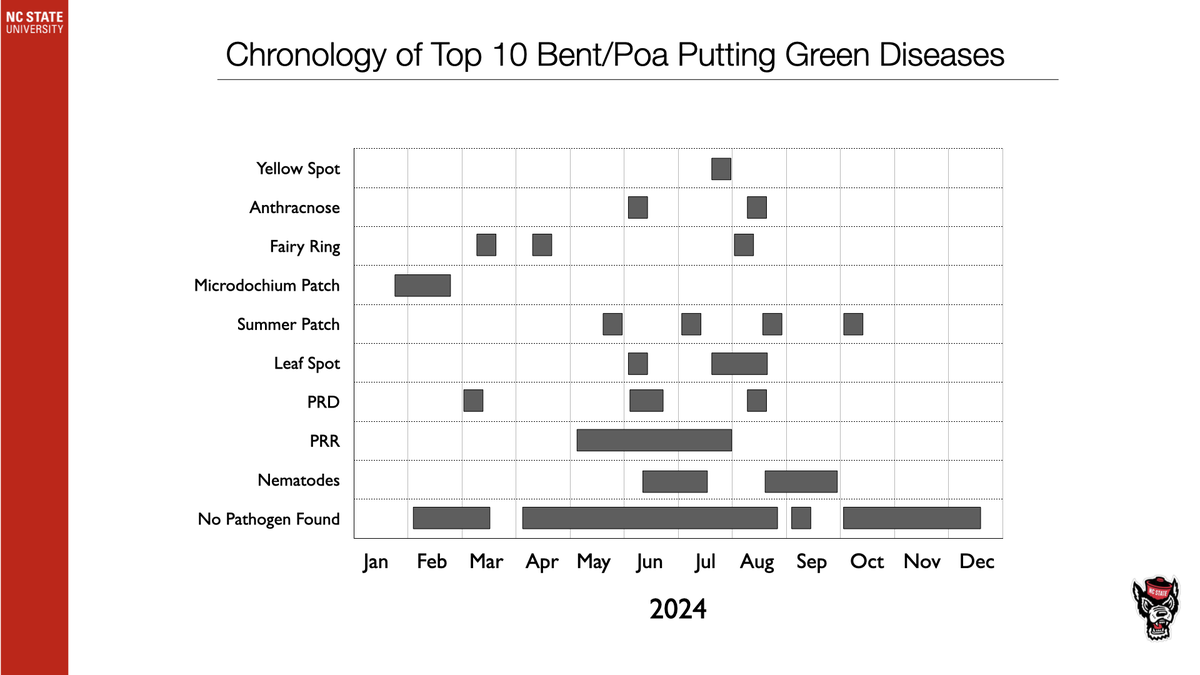
The chart above shows when each disease was diagnosed for bent/Poa, putting green samples. The smallest bars usually indicate only a handful of confirmed cases, whereas the larger bars represent many confirmed cases through that time period.
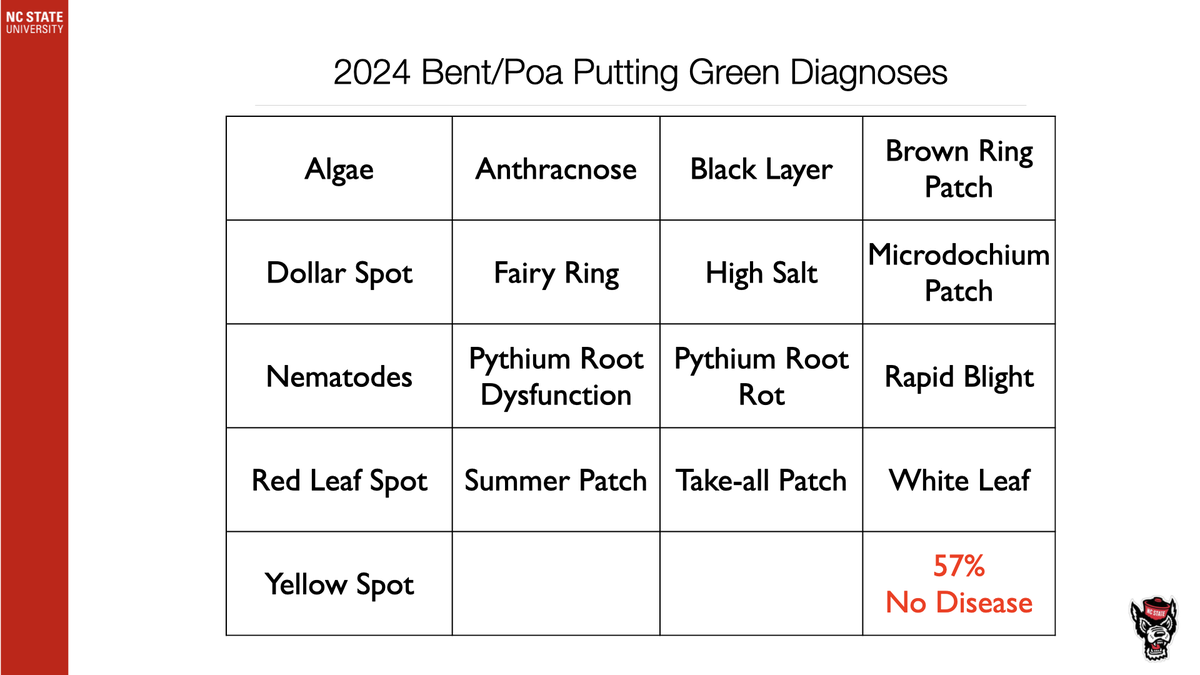
As with last year’s report, we have added all the diagnoses we made throughout the year to illustrate what we see and include those that don’t make the top 10 list above. There were 17 different disease diagnoses in 2024 on creeping bent/Poa samples.
While this is the inverse of the bent/Poa chart above, this graph shows the rise of bermudagrass putting green samples over the past several years due to the industry shift towards these grasses for putting green surfaces, as mentioned previously. It appears to have reached a plateau for now.
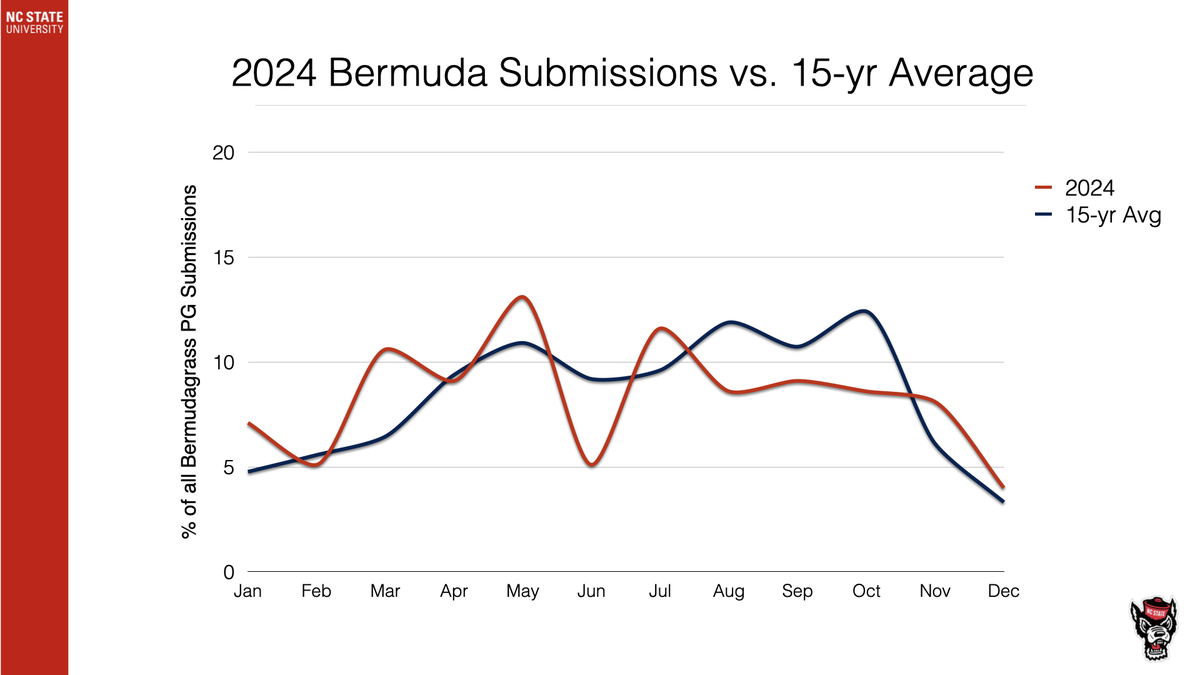
As usual, bermudagrass sample submissions are never predictable from year to year compared to creeping bentgrass, which spikes almost perfectly every year in July.
However, based on a 15-year average, we see roughly three distinct times when bermudagrass samples are submitted to our lab for biotic and abiotic reasons. The first wave is at green-up in the spring, the second wave is mid-summer, and the third wave is during the onset of dormancy. While the first and third waves make sense, the second wave has piqued our curiosity. We will investigate this further this year with continued research to better understand root and biomass production by the major cultivars in our region (Champion, G12, Mini Verde, and TifEagle) … stay tuned!
Unfortunately, take-all root rot (TARR) remains at the top of the list year after year. Soilborne diseases can be associated with nematode feeding and may not always be the primary causal agent. In many cases where I diagnose TARR or Pythium root rot, I encourage clients to submit samples to a nematode lab for an assay. It is very common for me to see severely stunted root systems associated with these diseases in bermudagrass samples. Either way, we often see positive outcomes in turf quality when good fungicides are used in these situations.
Like bentgrass diseases, many of these can look alike and require a microscope to make an accurate diagnosis. It should be noted that while we do not offer a service for a nematode assay, we do report root-knot and lance nematodes because they are endoparasites (inside the roots) and easy to see/don’t get washed away like ectoparasites (outside the roots).
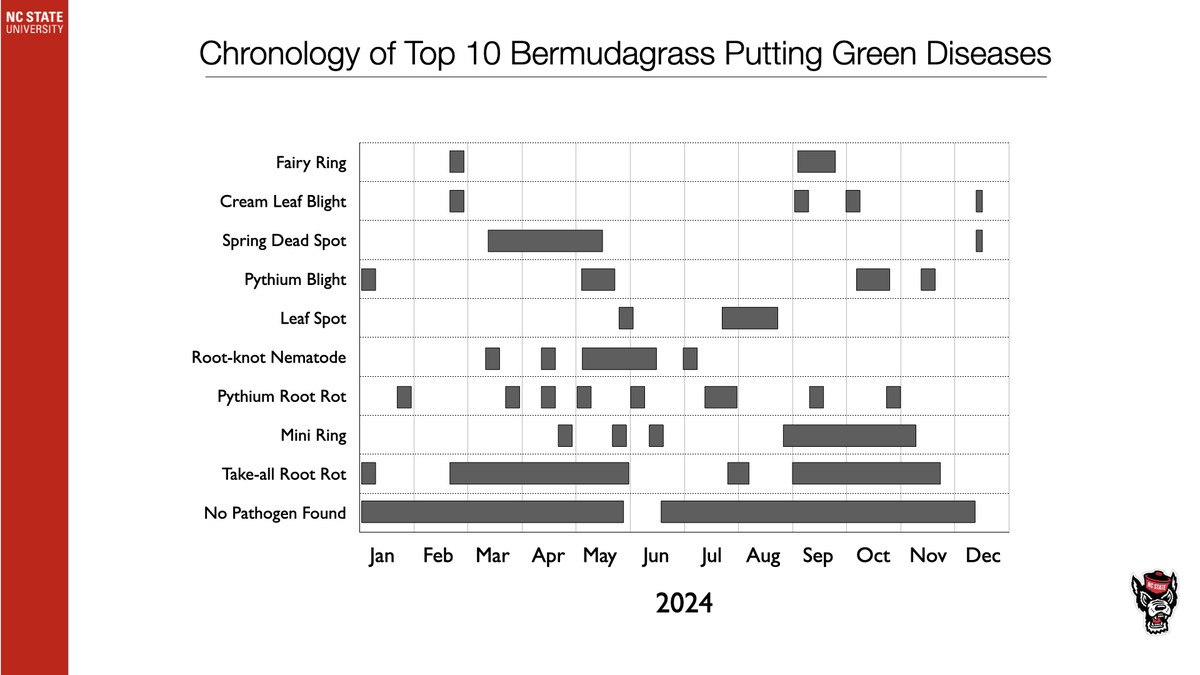
The chart above shows when each disease was diagnosed for bermudagrass, putting green samples. The smallest bars usually indicate only a handful of confirmed cases, whereas the larger bars represent many confirmed cases through that time period. Just like in recent years, we received a lot of mini-ring samples late summer through early fall in 2024, with many diagnoses being made over email and text messages via photos, which are not counted as physical samples as represented above. We believe mini ring is more severe under low fertility and it’s likely those affected may have lost more fertility than they realized during the extended rainfall periods before symptom development.
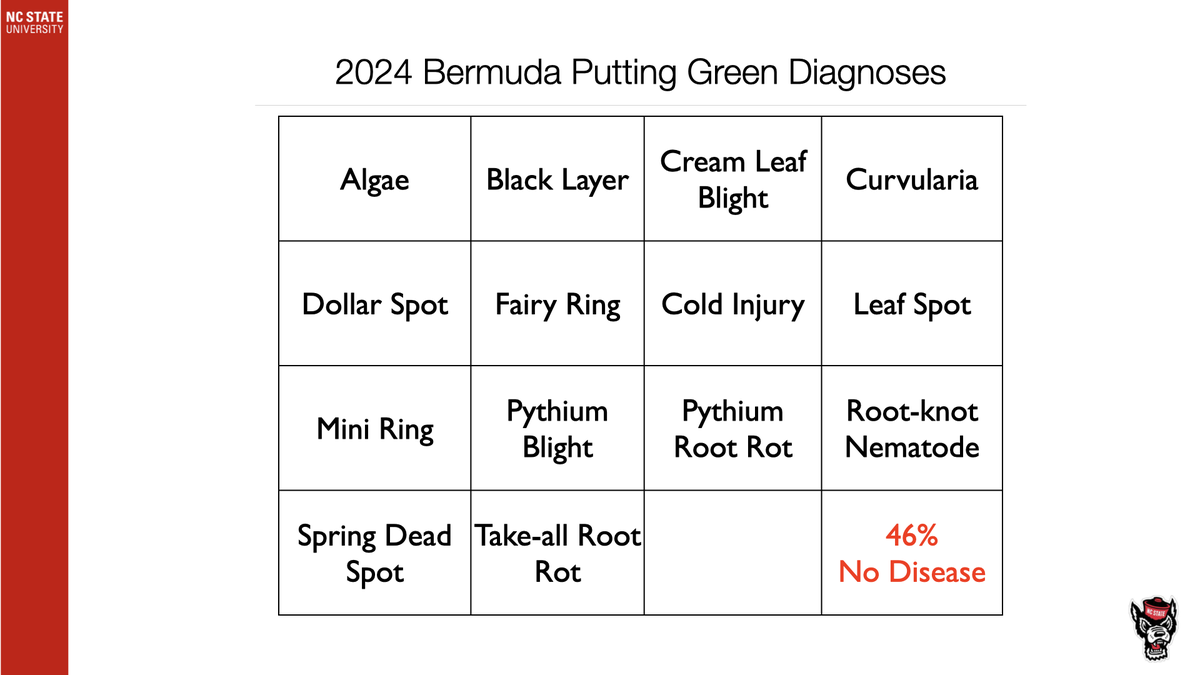
Above are all the diagnoses we made throughout the year to illustrate what we see and include those that don’t make the top 10 list above. There were 14 different disease diagnoses in 2024 on bermudagrass samples.
If you would like to see this same information from recent years, please click the links below :